The Bureau of Labor Statistics published the July employment situation report at 8:30 this morning. By this afternoon the headline payroll figure will have been quoted in every market summary, compared against the consensus forecast, and used to justify a view on what the Federal Reserve does in September.
That figure will be revised twice. It may well be revised again after that, and then adjusted a final time in an annual benchmark that rewrites several years of history at once.
None of this is a criticism of the BLS. Revision is a feature of the methodology, not a defect in it. But the gap between how provisional the first estimate actually is and how definitively it gets reported is the single largest source of avoidable error in reading labour market data.
Two surveys, not one
The employment report is not one measurement. It is two independent surveys published together, and the two headline numbers everyone quotes come from different places.
- The establishment survey asks employers how many people are on their payrolls. It produces the nonfarm payroll figure. It counts jobs, so a person holding two jobs is counted twice, and it excludes the self-employed and unincorporated business owners entirely.
- The household survey asks people about their own employment status. It produces the unemployment rate and the participation rate. It counts people, includes the self-employed, and has a far smaller sample.
Because they measure different things with different instruments, they frequently disagree — sometimes sharply, and sometimes for many months. A report showing weak payroll growth alongside a stable unemployment rate is not a contradiction requiring explanation. It is two surveys doing what they do.
The household survey is also the noisier of the two. Its sample is small enough that the month-to-month movement in the employment level routinely exceeds what the BLS itself considers statistically significant. Commentators nonetheless build narratives on it every month.
Why the payroll number moves after publication
The first estimate of any month’s payroll change is published before most employers have responded to the survey. The BLS publishes on a fixed schedule rather than waiting for complete collection, so the initial figure is built from a partial sample and an estimate of what the missing responses will look like.
Each of the next two months brings in more of the outstanding responses, and the estimate is updated accordingly. This is why every report revises the two preceding months as a matter of course. The revision is not new information about the economy; it is the same month measured with a fuller sample.
Two further adjustments sit on top of that:
- Seasonal adjustment. Raw employment swings enormously across the year for reasons nobody needs reported — retail hiring in November, construction in winter, education in summer. The published figure is adjusted to strip those patterns out. The adjustment factors are themselves re-estimated annually, so seasonally adjusted history changes even when the underlying raw data does not.
- The annual benchmark. Once a year the establishment survey is reconciled against unemployment insurance tax records, which cover nearly all employment rather than a sample. This is the closest thing to a true count available, and it can move the level of employment by hundreds of thousands of jobs across the benchmark period.
The revisions have been large recently
The June report, published on 2 July, is a useful illustration of how much movement is normal.
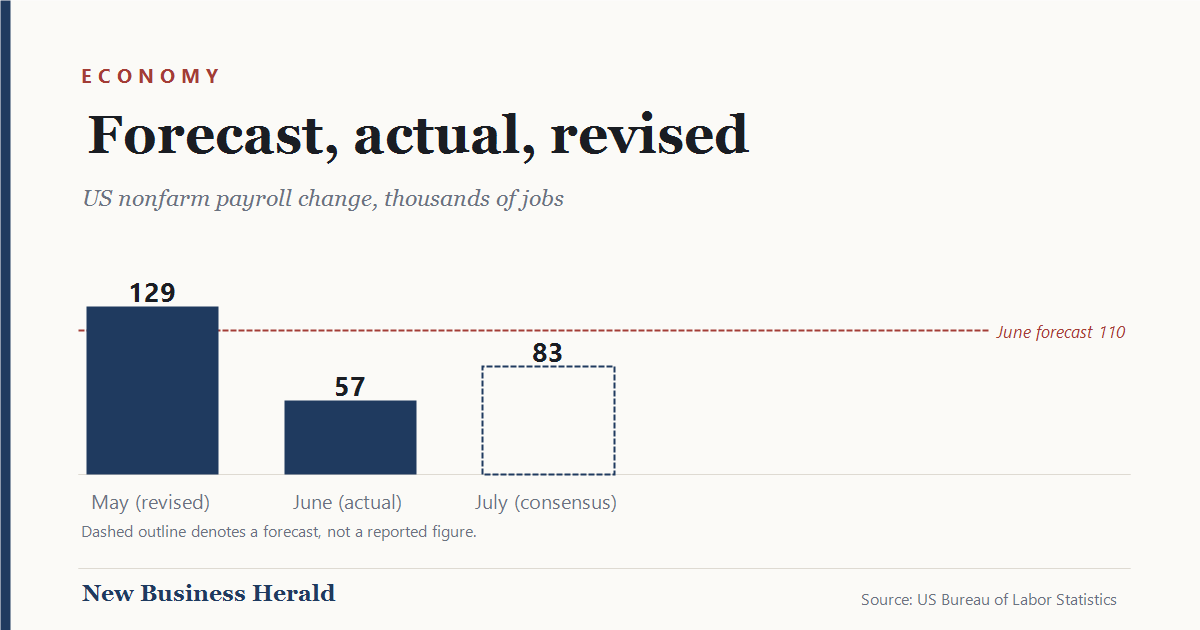
June payrolls came in at 57,000 — the weakest gain in four months, and well below the roughly 110,000 economists had expected. In the same release, May’s figure was revised down to 129,000. Two data points that had already been reported, absorbed and traded on turned out to describe a slower labour market than the market believed at the time.
Consensus for this morning’s July report sat in the region of 80,000 to 85,000, with the unemployment rate expected to hold at 4.2 percent. Whatever the actual figure, the same caution applies to it: the number published today is the least accurate estimate of July employment that will ever exist. Every subsequent version will be better.
Reading a report properly
Four habits materially improve the signal you extract from these releases.
- Read the three-month average, not the month. Averaging suppresses sampling noise and survives revision far better than any single print. A single month that misses consensus by 30,000 is inside the noise band. A three-month average that has halved is a trend.
- Read the revisions before the headline. A report showing 100,000 new jobs alongside 80,000 stripped from prior months is a weaker report than one showing 60,000 with no revisions. Coverage almost always leads with the headline and buries the revision.
- Check the composition. Job growth concentrated in healthcare and social assistance — sectors driven by demographics and public funding rather than the business cycle — carries a different signal than broad-based private hiring, even at an identical headline number.
- Watch participation alongside the unemployment rate. The unemployment rate can fall because people found work or because they stopped looking. Those are opposite economic events producing an identical headline. Participation and the employment-to-population ratio distinguish them.
Why it matters more than usual right now
The Federal Reserve held its policy rate at 3-1/2 to 3-3/4 percent on 29 July on a 9–3 vote, with three regional presidents dissenting in favour of a quarter-point increase — the first unified three-member dissent since September 2016.
A committee that divided is unusually sensitive to incoming data, which means each release between now and the September meeting carries more weight than it normally would. It also means each release is more likely to be over-interpreted. A committee looking for confirmation is exactly the environment in which a noisy monthly figure gets treated as decisive.
The honest position on any single employment report is that it moves the balance of evidence slightly and settles nothing. That is a less satisfying conclusion than the ones published this morning, and it is considerably more likely to survive the next two revisions.
Sources: Bureau of Labor Statistics, Employment Situation news release and release schedule; consensus estimates as reported by Bloomberg and CNBC ahead of the 7 August publication.